What Does Your i-Ready Diagnostic Score Mean for Reading and Math
A comprehensive guide to understanding placement levels, percentile ranks, and 2026 grade-level expectations.
When report cards and progress reports arrive, parents are often presented with a three-digit number labeled as an "i-Ready Diagnostic Score." Without proper context, a score of 450 or 612 means very little. Is it a good score? Is the student falling behind? Does it correlate to their actual classroom grades?
Developed by Curriculum Associates, the i-Ready diagnostic is a criterion-referenced achievement test used by thousands of school districts across the United States. It is administered typically three times a year—Fall (Beginning of Year), Winter (Middle of Year), and Spring (End of Year)—to measure student growth in Reading and Mathematics.
This comprehensive resource breaks down exactly how to interpret these scores, provides the 2026 placement charts for K-8 students, and explains the psychological and technical nuances of adaptive testing that often cause unnecessary parental anxiety.
How to Find Your Child’s i-Ready Diagnostic Score in the Portal
Before you can interpret the results, you need to locate the official score report. Many school districts use single sign-on portals, which means you will likely need your child's login credentials to access the data.
- Log into the School Portal: Access your district's specific portal (often Clever or ClassLink) using your student's username and password.
- Select the Subject Area: Once inside the i-Ready dashboard, you will be prompted to choose either the Reading or Math subject area.
- Navigate to Progress: Locate and click the "My Progress" icon, typically found at the bottom of the screen.
- View Historical Data: Select the "Completed Work" tab to view a history of lessons and assessments.
- Identify the Score: Look for the 3-digit number specifically labeled "Diagnostic." This is the scale score you will use to check against the placement charts below.
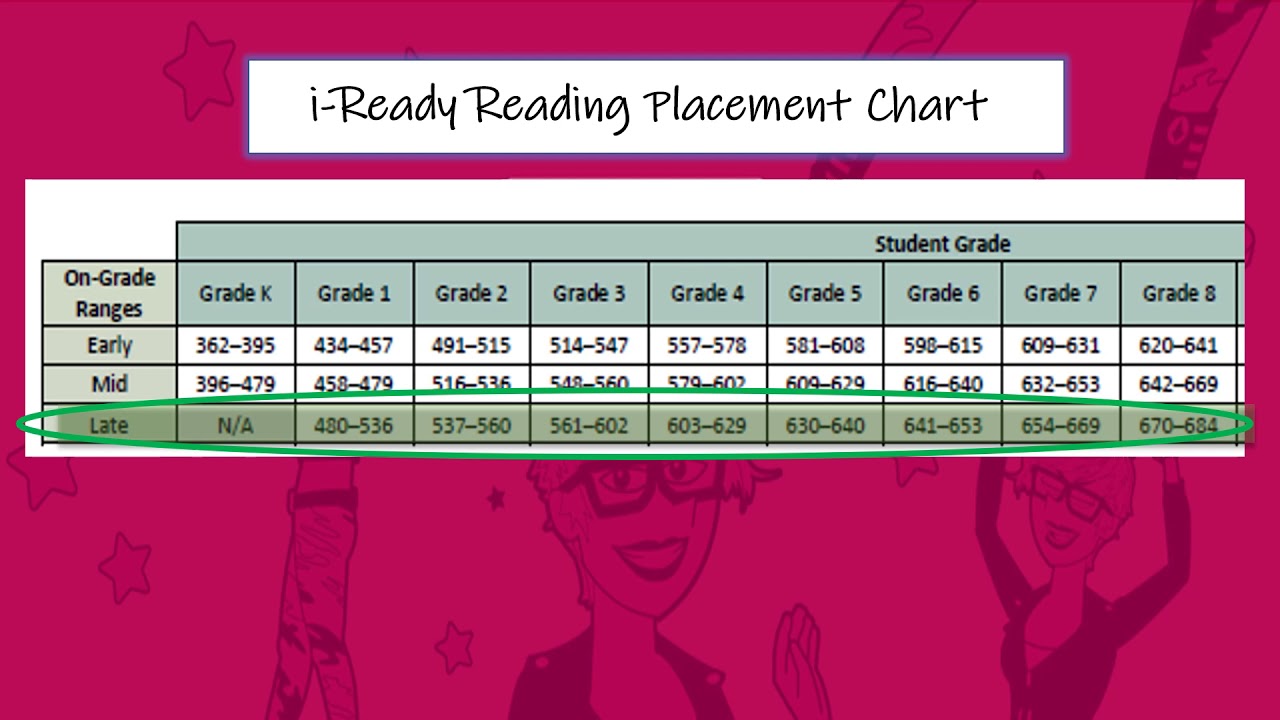
Image source: YouTube
According to the McDuffie Middle School Parent Resource Guide, parents should also look for the "Typical Growth" and "Stretch Growth" targets listed next to the score, which indicate how many points the student is expected to gain by the end of the academic year.
What Do the Different Placement Levels Mean for Your Student
The 100–800 scale score is mapped to specific placement levels based on national norms. These levels help educators determine if a student is ready for current grade-level instruction or if they require targeted intervention.
The student has successfully met the foundational requirements for their current grade and is prepared to engage with advanced, grade-level material. They are demonstrating mastery of core concepts.
The student is on track but currently sits at the lower end of the grade-level range. They have partial mastery of the necessary skills and will benefit from standard classroom instruction to solidify their knowledge.
The student is performing at the level of the previous academic year. Targeted intervention and specific "My Path" lessons are typically assigned to bridge these specific domain gaps before they widen.
Significant support is required. The student is missing critical foundational skills from multiple years prior, making it highly difficult to access current grade-level curriculum without specialized assistance.
Occasionally, a parent will see "Tested Out" listed next to a specific domain (such as Phonics for a 4th grader). This does not mean the test broke; it means the student hit the absolute ceiling for that specific skill area. The i-Ready algorithm recognizes that the student has mastered this domain and will stop assigning lessons in that category, redirecting focus toward higher-level skills like Vocabulary and Comprehension.
2026 i-Ready Diagnostic Score Charts for Reading
Reading scores are broken down into several key domains: Phonological Awareness, Phonics, High-Frequency Words, Vocabulary, and Comprehension (both Literature and Informational Text). A student's overall scale score is a composite of their performance across these areas.
The table below outlines the "On-Grade Level" scale score ranges for the current academic year. Notice how the target score increases from Fall (Early) to Spring (Late) as the student is expected to learn new material throughout the year.
| Grade Level | Fall (Early Year) | Winter (Mid Year) | Spring (Late Year) |
|---|---|---|---|
| Kindergarten | 362 – 395 | 396 – 413 | 414 – 423 |
| Grade 1 | 434 – 457 | 458 – 470 | 471 – 479 |
| Grade 2 | 489 – 512 | 513 – 526 | 527 – 536 |
| Grade 3 | 511 – 544 | 545 – 560 | 561 – 602 |
| Grade 4 | 557 – 578 | 579 – 592 | 593 – 602 |
| Grade 5 | 581 – 608 | 609 – 619 | 620 – 629 |
| Grade 6 | 598 – 615 | 616 – 640 | 641 – 653 |
| Grade 7 | 625 – 642 | 643 – 656 | 657 – 669 |
| Grade 8 | 640 – 661 | 662 – 673 | 674 – 684 |
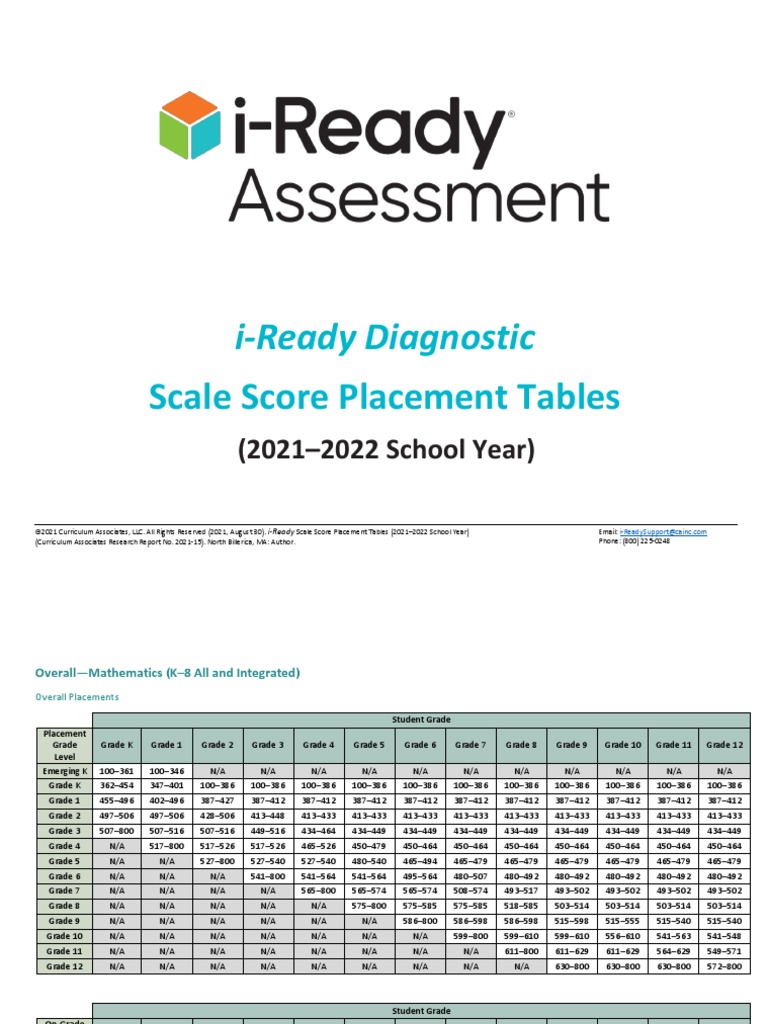
Image source: Scribd
Correlation to Lexile Measures
One of the most practical applications of the i-Ready Reading score is its correlation to Lexile measures. According to data compiled by Think Academy, a student's scale score can be directly translated into a Lexile range, which helps parents and librarians select appropriately challenging books. For instance, a 4th-grade student scoring a 580 on the diagnostic typically reads at a Lexile level of 740L to 940L. Selecting books within this range ensures the student is challenged without becoming frustrated.
2026 i-Ready Diagnostic Score Charts for Mathematics
The Mathematics diagnostic evaluates students across four primary domains: Number and Operations, Algebra and Algebraic Thinking, Measurement and Data, and Geometry. In early grades, the focus is heavily weighted toward Number and Operations (basic arithmetic and number sense), while middle school assessments shift heavily toward Algebraic Thinking.
| Grade Level | Fall (Early Year) | Winter (Mid Year) | Spring (Late Year) |
|---|---|---|---|
| Kindergarten | 362 – 372 | 373 – 401 | 402 – 412 |
| Grade 1 | 402 – 412 | 413 – 437 | 438 – 448 |
| Grade 2 | 428 – 440 | 441 – 463 | 464 – 474 |
| Grade 3 | 449 – 463 | 464 – 506 | 507 – 516 |
| Grade 4 | 465 – 481 | 482 – 516 | 517 – 526 |
| Grade 5 | 480 – 497 | 498 – 526 | 527 – 540 |
| Grade 6 | 495 – 513 | 514 – 540 | 541 – 564 |
| Grade 7 | 507 – 525 | 526 – 551 | 552 – 574 |
| Grade 8 | 518 – 539 | 540 – 565 | 566 – 585 |
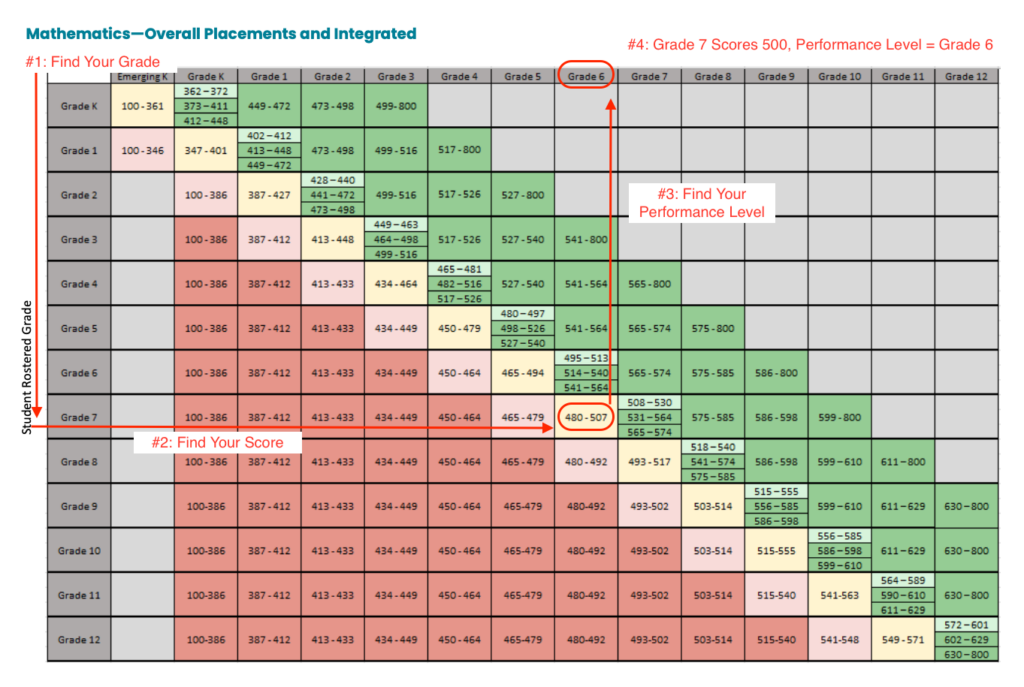
Image source: Think Academy
Correlation to Quantile Measures
Similar to how Reading scores map to Lexile levels, Math scores map to Quantile measures. A Quantile measure indicates a student's readiness to learn specific mathematical concepts. If a student has a Quantile measure of 600Q, they are ready to learn concepts rated around 600Q (such as basic fractions). If a teacher attempts to introduce a concept rated at 850Q (such as complex algebraic equations), the student will likely struggle, regardless of their effort level.
Why Your Child’s Score Might Seem Lower Than Expected
It is incredibly common for parents to review an i-Ready score report and feel a sense of panic, especially if their child typically earns A's and B's on classroom report cards. However, classroom grades and adaptive diagnostic scores measure two very different things. Understanding the mechanics of the test can alleviate much of this anxiety.
The "50% Correct" Adaptive Algorithm
The most crucial concept for parents to understand is that the i-Ready diagnostic is an adaptive assessment based on Item Response Theory (IRT). Unlike a traditional spelling test where the goal is to get 100% of the questions right, the i-Ready algorithm is actively searching for the student's "ceiling."
According to the i-Ready Central Family Center, if a student answers a question correctly, the next question will be harder. If they answer incorrectly, the next question will be easier. The system continues this process until it finds the exact difficulty level where the student is answering correctly about 50% of the time. Therefore, every student, regardless of how advanced they are, will feel like the test is difficult and will miss roughly half the questions.
The Computer Literacy Variable (Grades K-1)
For early elementary students, the diagnostic often measures computer literacy and attention span just as much as it measures academic knowledge. A five-year-old taking the test in the Fall may struggle to use a trackpad to drag and drop shapes, resulting in a low math score. By the Spring, their score might jump 100 points. While some of this is academic growth, a significant portion is simply the child learning how to navigate the digital interface. Parents of K-1 students should view Fall baseline scores with a grain of salt.
The Summer Slide and Shifting Percentile Norms
Another common point of confusion discussed frequently on educational forums like DCUrbanMom is the shifting nature of percentile ranks. A student might score a 450 in the Fall and be placed in the 70th percentile nationally. If they score a 455 in the Spring, their scale score went up, but their percentile rank might drop to the 45th percentile.
Why does this happen? Because the national average moves up as the school year progresses. A score of 450 is excellent in September, but by May, most students have learned a year's worth of material and have surpassed that score. If your child's scale score remains stagnant, their percentile rank will naturally fall.
How i-Ready Scores Predict Performance on State Standardized Tests
School districts do not use i-Ready simply for the sake of testing; they use it as a predictive tool. According to technical whitepapers published by Curriculum Associates, i-Ready diagnostic scores have a high statistical correlation with performance on 46 different state summative assessments (such as the SBAC, PARCC, and various state-specific end-of-year tests).
Educators rely heavily on the Winter (Middle of Year) diagnostic. By January or February, a student's i-Ready score serves as a highly accurate predictor of whether they will pass their state-mandated testing in May. If a student is scoring in the "Red" zone (Two or More Grade Levels Below) during the Winter diagnostic, schools will typically initiate Tier 2 or Tier 3 interventions immediately, as standard classroom instruction alone will likely not be enough to prepare them for state testing.
Actionable Steps to Improve Your Child’s i-Ready Score
While parents cannot (and should not) "teach to the test" for an adaptive diagnostic, there are several evidence-based strategies to ensure a student's score accurately reflects their true ability.
Data shows that student performance drops significantly after 30 minutes of continuous testing on an adaptive platform. Because the questions get progressively harder, cognitive fatigue sets in quickly. If your school allows testing at home, or if you are advising your child before an in-school test, encourage them to take the diagnostic in 25- to 30-minute chunks. Rushing through a 60-minute session almost always results in an artificially depressed score.
Reframing Test Anxiety
Because the test is designed to be difficult, many high-achieving students experience severe anxiety when they encounter questions they don't know. Parents should proactively explain the 50% rule to their children. Tell them: "The computer is going to give you questions you haven't learned yet on purpose. It's trying to see how far you can go. It is completely okay to guess on those." Reframing the test as a "puzzle" rather than a "grade" can significantly reduce anxiety and improve focus.
Targeted Practice via "My Path"
The most powerful feature of the i-Ready ecosystem is the "My Path" personalized instruction. Once the diagnostic is complete, the software automatically generates a sequence of interactive lessons tailored specifically to the domains where the student struggled. If a student scored poorly in Phonics but highly in Vocabulary, their "My Path" will heavily feature phonics games and exercises. Encouraging your child to complete 30 to 45 minutes of "My Path" lessons per week is widely regarded as one of the most effective ways to boost their subsequent diagnostic scores.
Frequently Asked Questions
- What is considered a "good" i-Ready score?
- A "good" score is entirely relative to the student's grade level and the time of year. Generally, any score that places a student in the "Mid or Above Grade Level" (Green zone) on the placement charts is considered a strong, on-track performance. For example, a score of 550 is excellent for a 3rd grader in the Fall, but would indicate a need for support for a 6th grader.
- What is the highest possible score on the i-Ready diagnostic?
- The absolute maximum scale score on the i-Ready diagnostic is 800. However, students rarely reach this number, as the test is designed to measure K-12 growth. A high school senior performing exceptionally well might score in the high 700s, but "maxing out" is not the goal of the assessment.
- Why did my child's score go down from Winter to Spring?
- A drop in scale score (often called a negative growth score) is usually not indicative of a child "forgetting" how to read or do math. It is most commonly caused by testing fatigue, rushing, or a lack of motivation during the End of Year assessment. If a student clicks through the Spring test just to get it over with, their score will drop significantly compared to a Winter test where they took their time.
- Is the i-Ready diagnostic an IQ test?
- No. The i-Ready diagnostic is a criterion-referenced achievement test. It measures specific academic skills in reading and mathematics that have been taught in school. It does not measure innate intelligence, cognitive processing speed, or overall IQ.
- How often do students take the i-Ready diagnostic?
- Most school districts administer the diagnostic three times per academic year: Fall (Beginning of Year to establish a baseline), Winter (Middle of Year to check progress), and Spring (End of Year to measure total annual growth).
Final Thoughts on Navigating i-Ready Results
The i-Ready diagnostic is a powerful tool for measuring academic growth, but it is just one data point in your child's educational journey. It should never be viewed as a permanent label of a student's ability, but rather as a roadmap for where they need to go next.
- Scale scores track long-term growth, providing a consistent metric from Kindergarten through 12th grade.
- Missing 50% of the questions is normal and is a deliberate feature of the adaptive algorithm designed to find the student's learning threshold.
- Percentile ranks will shift throughout the year; a stagnant scale score will result in a dropping percentile as national averages rise.
- Early elementary scores are often heavily influenced by computer literacy and attention span, not just academic knowledge.
- Use the "My Path" lessons to directly address the specific domain gaps identified by the diagnostic report.